Exploring Interactive Skill Visualization with React Libraries
Introduction
How do you make your portfolio stand out in a sea of static resumes? When building my portfolio, I wanted to find an interactive and visually appealing way to showcase my skill set. A static list or traditional resume felt outdated and lacked the engagement I was aiming for. I considered various approaches, from using cards to bubble graphs, but they didn’t quite hit the mark. After some exploration, I focused on three charting libraries that stood out: Victory, Nivo, and Recharts. Here’s what I discovered.
My Exploration of Charting Libraries
Before diving into the specifics, I was looking for charting libraries that could offer flexibility, ease of use, and seamless integration with React. Victory, Nivo, and Recharts stood out based on these criteria.
Victory
Victory was the first library I tried, and I was immediately impressed with its modular design and flexibility, especially with pie charts. It allowed me to customize and create complex charts with ease. However, I ran into some issues with type warnings in the network console. Despite my efforts to resolve these, the warnings persisted, which made me hesitant to use Victory in my final implementation.
Some details on Victory can be found here.
Nivo
Nivo caught my attention next with its rich set of charting components and beautiful default styles. It offered a range of interactive features that seemed perfect for my needs. However, after testing it, I found that it was more suited for complex data visualizations than the straightforward skill representation I was aiming for. The additional complexity wasn’t necessary for this project, so I decided to move on. Some Details on Nivo can be found here.
Recharts
Finally, I settled on Recharts. It combined the best aspects of Victory and Nivo, offering a simple yet powerful way to create responsive charts. What impressed me most was its seamless integration with React—no type issues or unexpected warnings. Recharts provided exactly what I needed: a clean, interactive way to display my skills without unnecessary clutter.
You can find more information about Recharts here.
Implementing the Pie Chart for Skill Visualization
To visualize my skills, I used Recharts to create a pie chart that represents different skill categories. Each section of the pie chart corresponds to a skill category, and clicking on a section reveals more details in a modal. This approach makes the skill section of my portfolio interactive and engaging, providing a quick overview with the option to dive deeper.
Implementing Overview
Here’s how I structured the implementation:
-
Responsive Pie Chart: I used Recharts’
PieChartandPiecomponents to create a responsive pie chart. The chart is designed to adapt to different screen sizes, ensuring a consistent user experience across devices. -
Interactive Modals: Clicking on a section of the pie chart triggers a modal that displays detailed information about the selected skill category. This interaction adds depth to the visualization, allowing users to explore my skills in more detail.
-
Dynamic Data Handling: The chart and modals are populated with data from a JSON file. This approach keeps the implementation clean and allows for easy updates and maintenance.
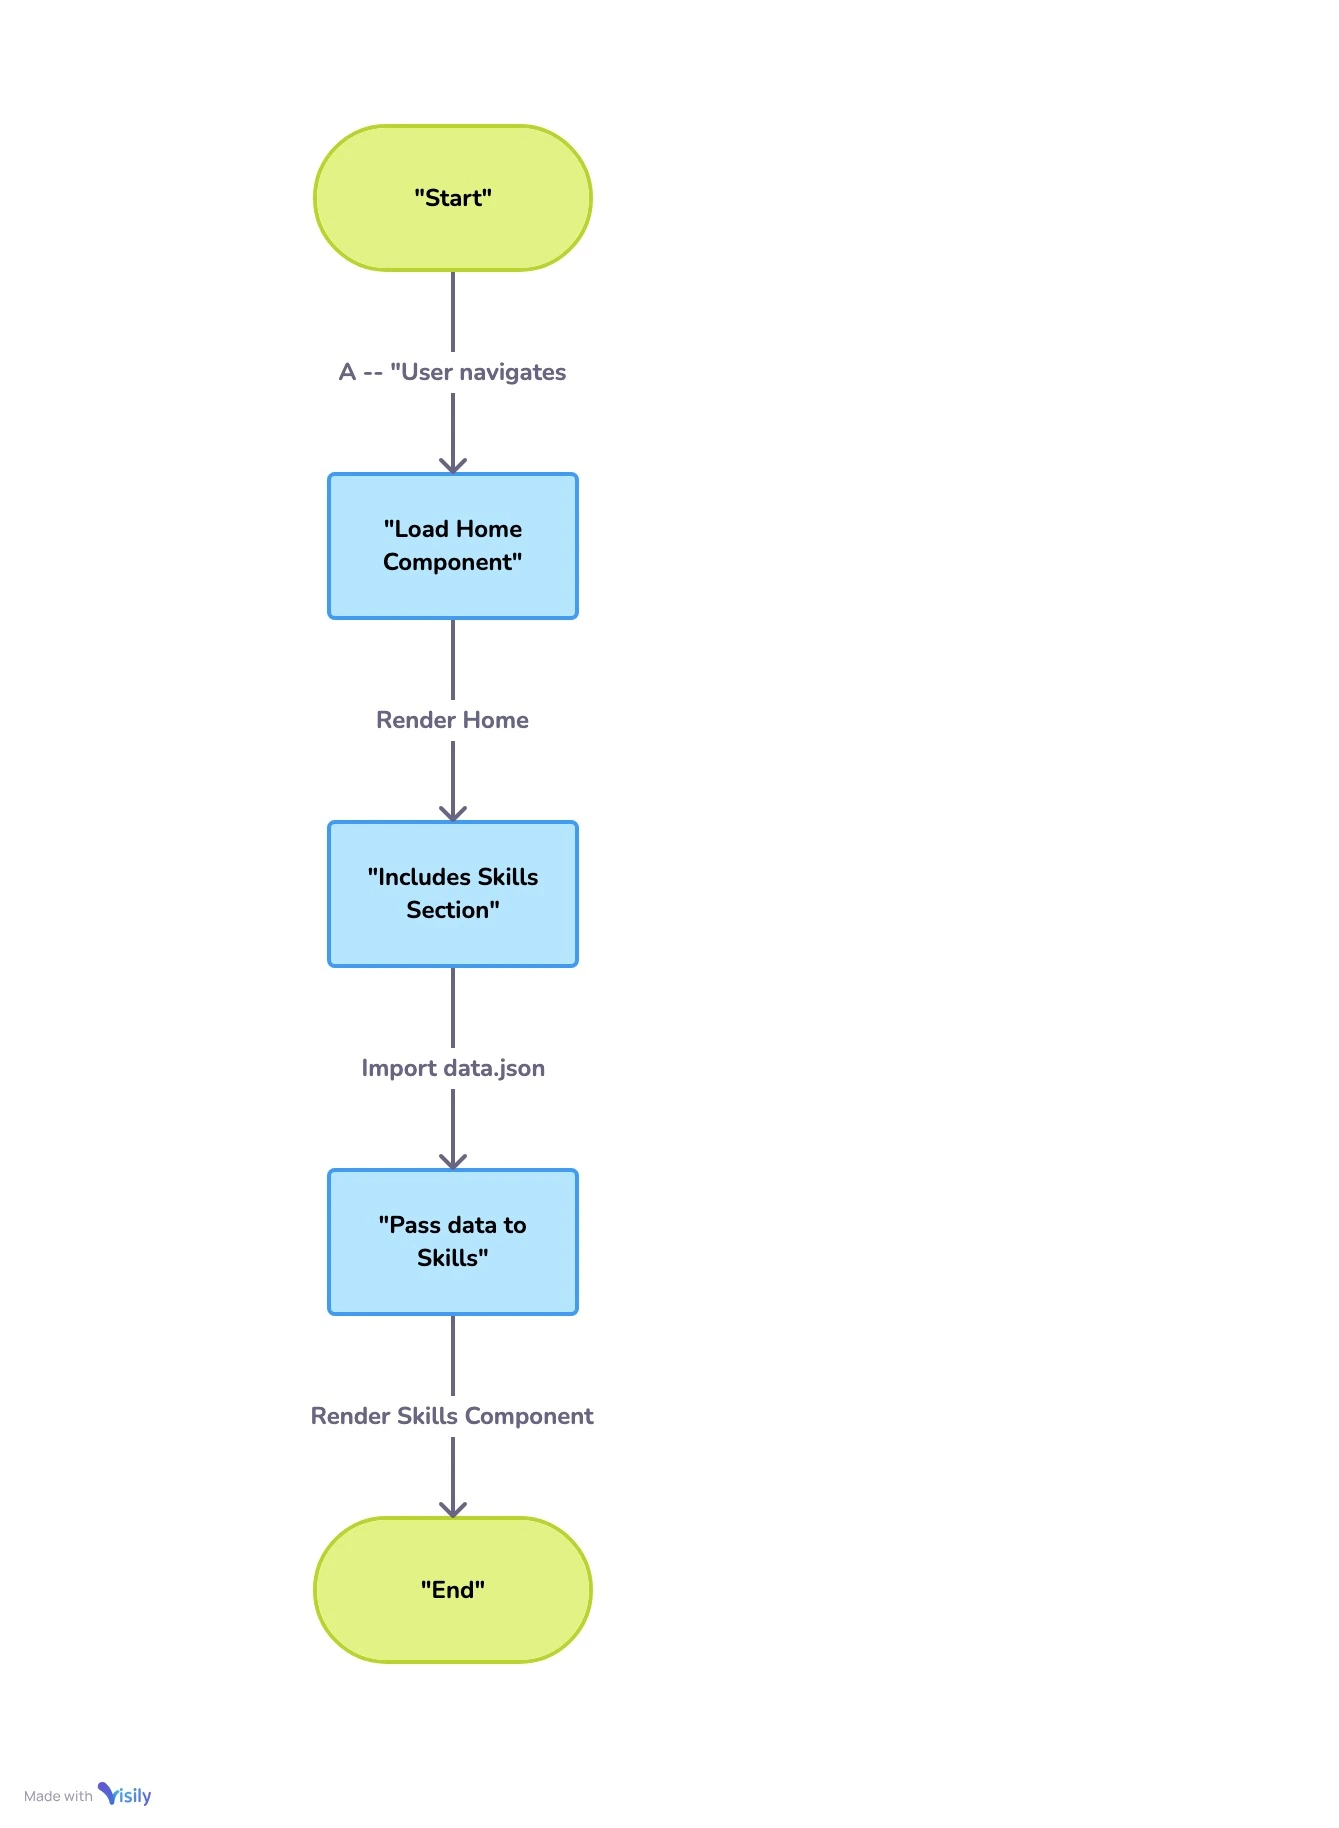 React Flow
Setup
Setting up the Project
To get started, I installed the necessary libraries that would help build the interactive components. The main libraries I used were antd for UI components and recharts for the interactive charts
npm install antd rechartsI chose antd for its consistent UI components, particularly for features like modals that seamlessly integrate with React. Recharts was selected for its robust support with React, offering a simple way to create responsive charts without any type issues.
Defining the Data Structure
Here is an example of the JSON structure used to represent a snippet of my skills:
{
  "title": "My Skills",
  "categories": [
    {
      "categoryName": "Frontend",
      "skills": [
        {"title": "React", "competency": "Proficient"},
        {"title": "JavaScript", "competency": "Proficient"}
      ]
    }
  ]
}
This data structure allowed me to dynamically update and maintain the skill sets with ease.
Understanding the Modal Component
The Modal component from antd plays a crucial role in enhancing user interaction by providing a clean and consistent way to display additional information. In this case, the Modal is used to display detailed information about a selected skill category when a user clicks on a segment of the pie chart. This approach helps keep the UI uncluttered, only showing detailed information when needed.
The Modal component is highly customizable, allowing you to define the content, title, and behavior when it is opened or closed. It’s integrated with React’s state management, making it easy to control its visibility and content dynamically.
Creating the Skill Component
Now that we understand what the Modal is doing, let’s look at how the Skill component is structured:
Import Dependencies
Import the following dependencies
import { Modal } from 'antd';
import React, { useState } from 'react';
import { Cell, Pie, PieChart, ResponsiveContainer, Tooltip } from 'recharts';
Component Structure
The skill component and state management
const Skill = ({ data }) => {
  const [selectedCategory, setSelectedCategory] = useState(null);
  const [isModalVisible, setIsModalVisible] = useState(false);
Handling User Interaction
How clicks on the pie chart trigger the modal
  const handlePieClick = (category) => {
    setSelectedCategory(category);
    setIsModalVisible(true);
  };
Rendering the Skill Pie Chart
The data structure is then mapped to the Pie Chart
  return (
    <div className="skills-container">
      <h2>{data.title}</h2>
      <ResponsiveContainer width="100%" height={400}>
        <PieChart>
          <Pie
            data={data.categories}
            dataKey="skills.length"
            nameKey="categoryName"
            cx="50%"
            cy="50%"
            innerRadius={100}
            outerRadius={150}
            fill="#8884d8"
            onClick={(entry) => handlePieClick(entry)}
          >
            {data.categories.map((entry, index) => (
              <Cell key={`cell-${index}`} fill={COLORS[index % COLORS.length]} />
            ))}
          </Pie>
          <Tooltip />
        </PieChart>
      </ResponsiveContainer>
Modal Component
The modal component helps to display additional information
      <Modal
        title={selectedCategory?.categoryName}
        visible={isModalVisible}
        onOk={() => setIsModalVisible(false)}
        onCancel={() => setIsModalVisible(false)}
      >
        <div>{selectedCategory?.description}</div>
      </Modal>
    </div>
  );
};
Exporting the Skill Component
export default Skill;Conclusion
In this project, we demonstrated how to create a simple and interactive skill visualization using React. By utilizing libraries like Recharts and Ant Design, we developed a basic example that is both functional and visually appealing. This approach showcases how you can incorporate dynamic charts into your projects, enhancing the overall user experience.
If you’re interested in seeing this basic implementation in action or want to explore the code further, you can reference the sample repository at react-demo.